
Satellite data everyone had, and nobody could use
Farmers, environmental consultants, and site planners all share one blind spot: land changes gradually, and by the time you can see it, the cheap fix has passed. The data to catch it early is free and public. Reading it required a GIS specialist. We closed that gap.
- Services
- Platform architecture, product design & engineering
- Category
- GeoTech / data intelligence platform
- Client
- GeoVerdant
- Stack
- Next.js · MapLibre GL · NestJS · FastAPI · PostgreSQL · rio-tiler · Redis
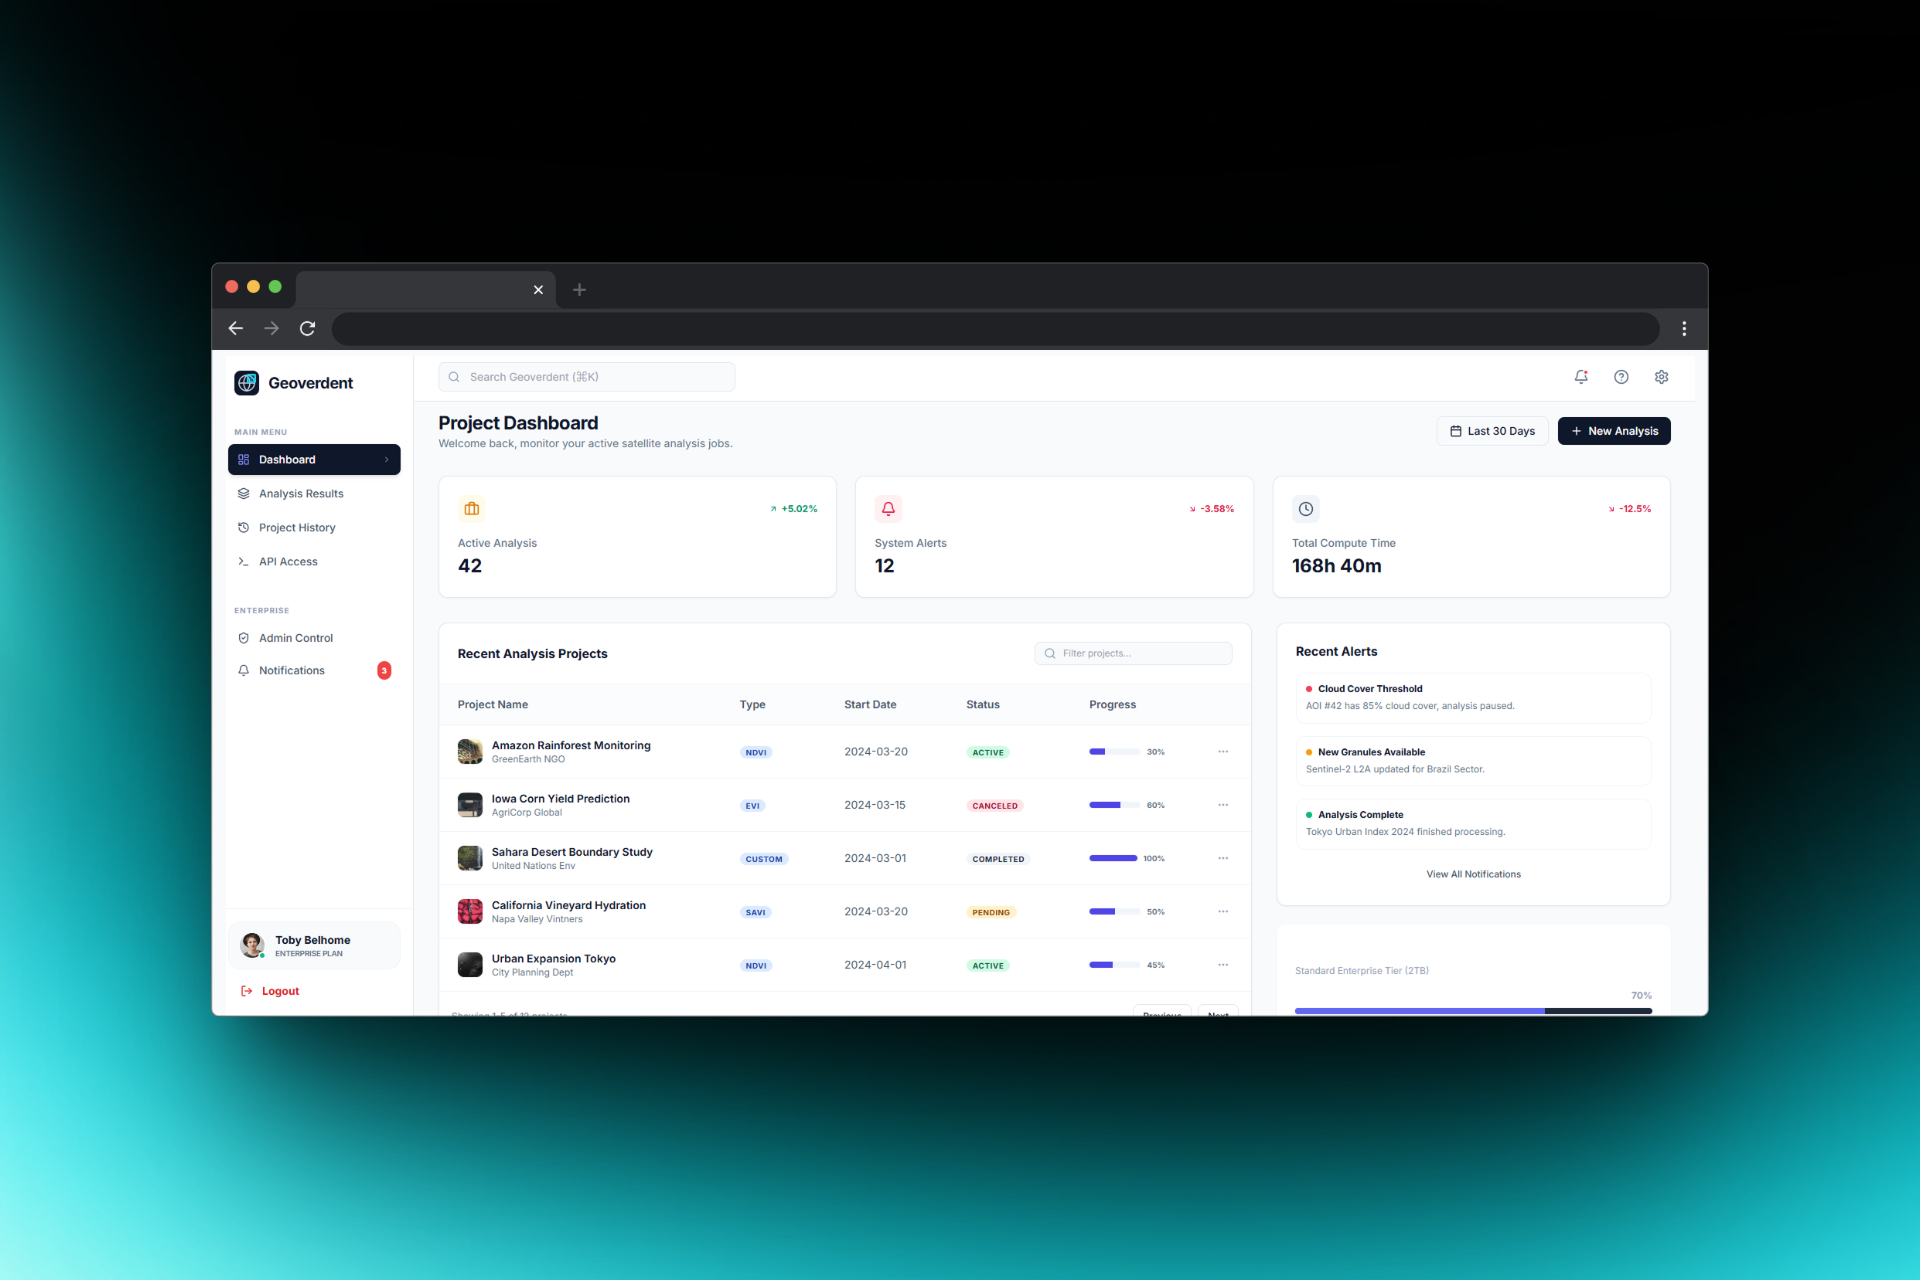
They had the data, but no clarity.
Public satellite imagery is abundant. Turning it into a decision took either a consultant visit or a desktop GIS tool built for specialists.
- No simple way to track land health over time
- Historical environmental context effectively inaccessible
- Satellite tooling too technical for the people deciding
- Site visits too slow and too expensive to repeat
- Decisions made on assumptions and outdated reports
- Problem areas invisible until they were obvious
What it was costing
- Farmers planning crops without an early read on stress
- Developers assessing sites on incomplete information
- Environmental trends going unnoticed until irreversible
- Every decision reactive instead of planned
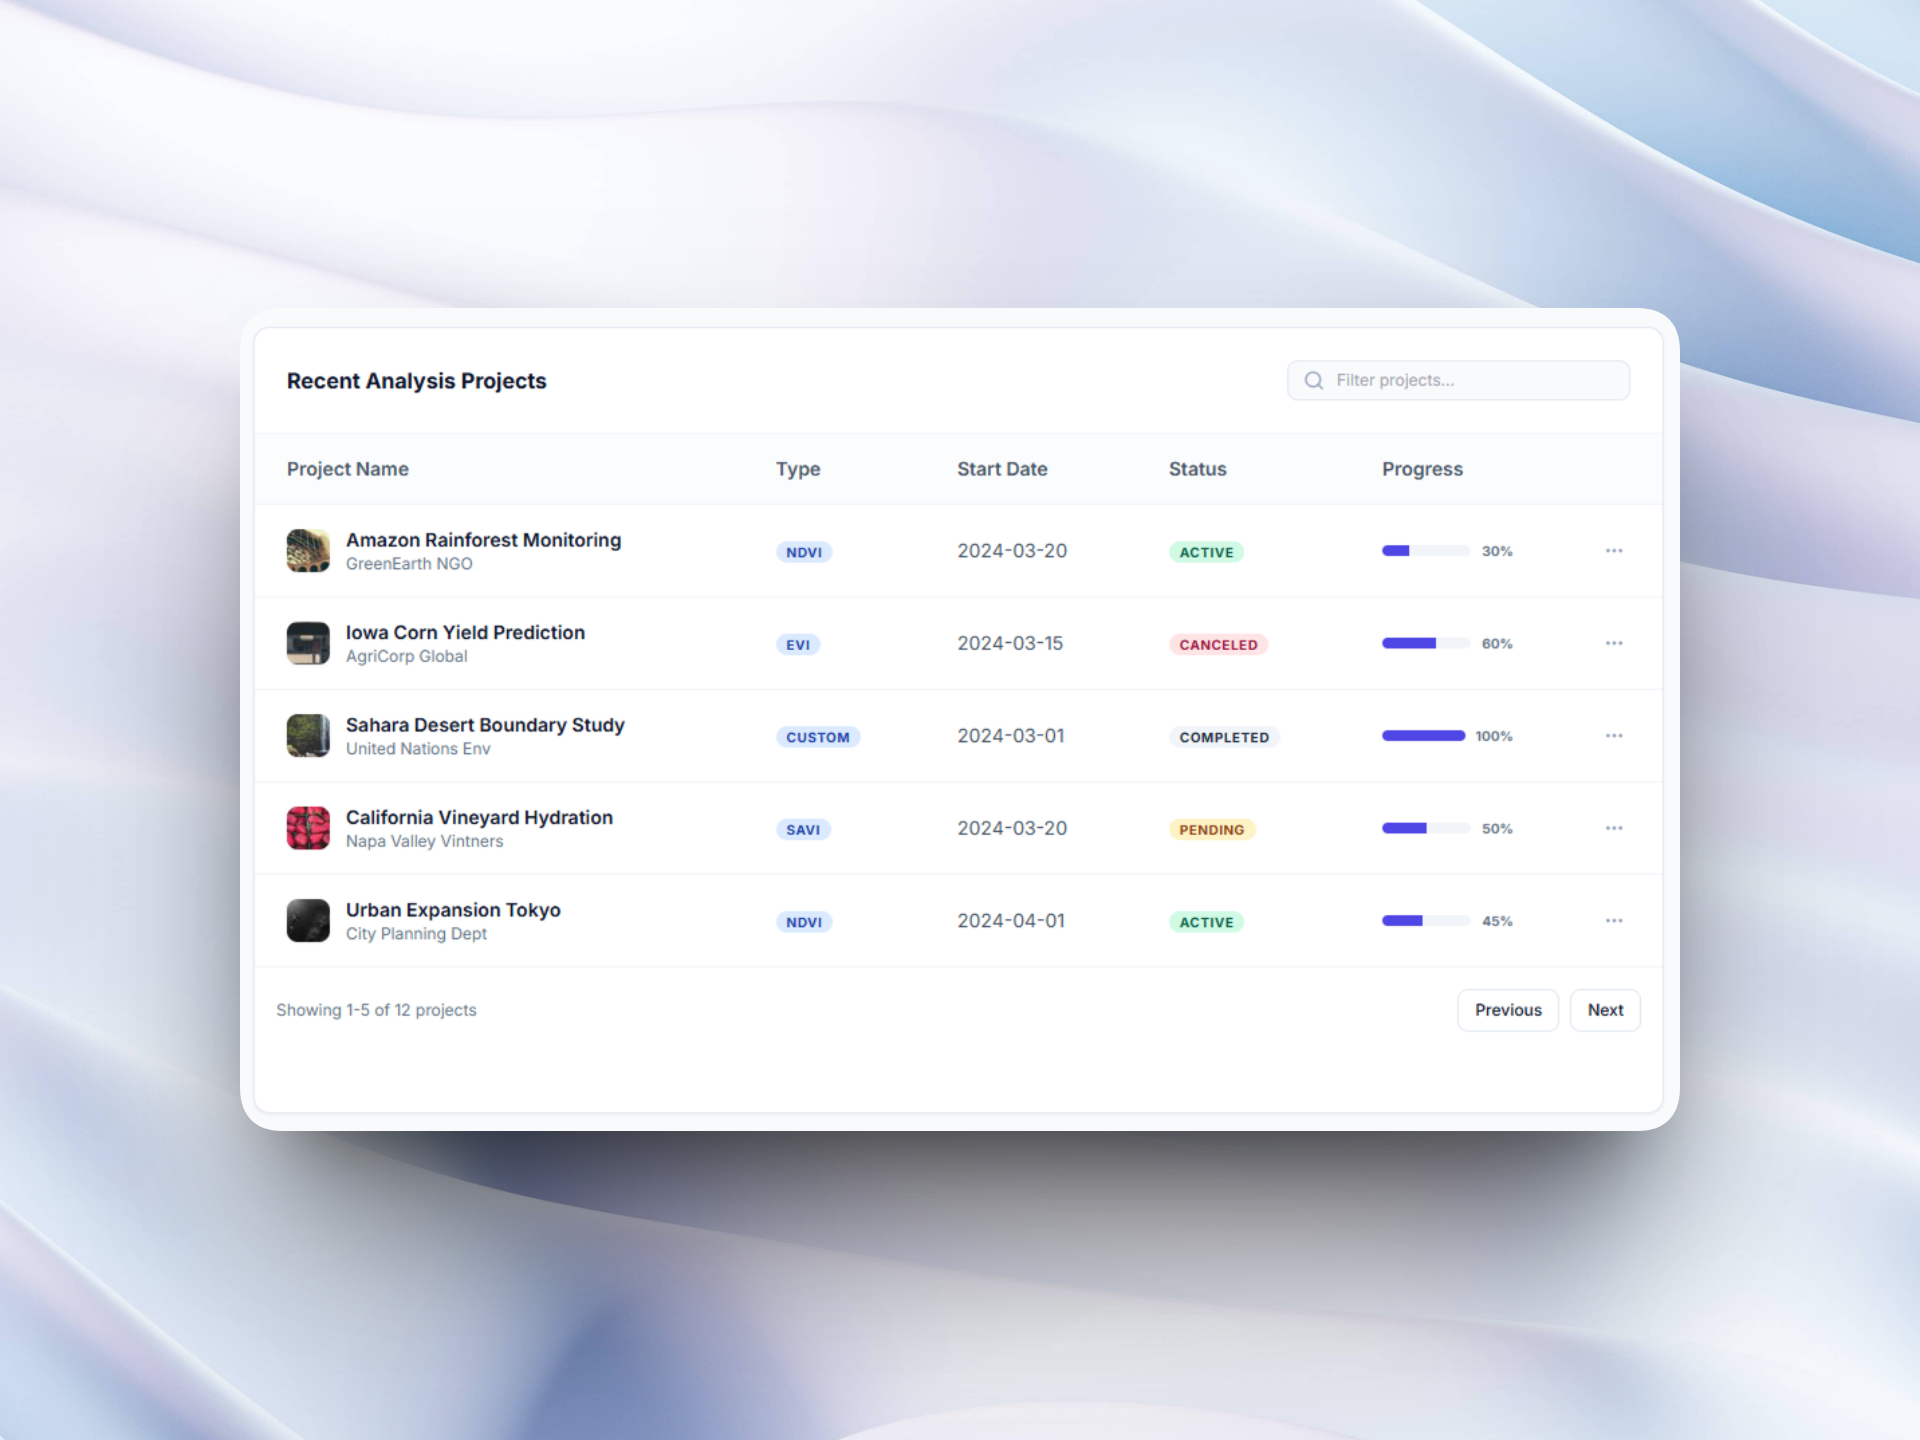
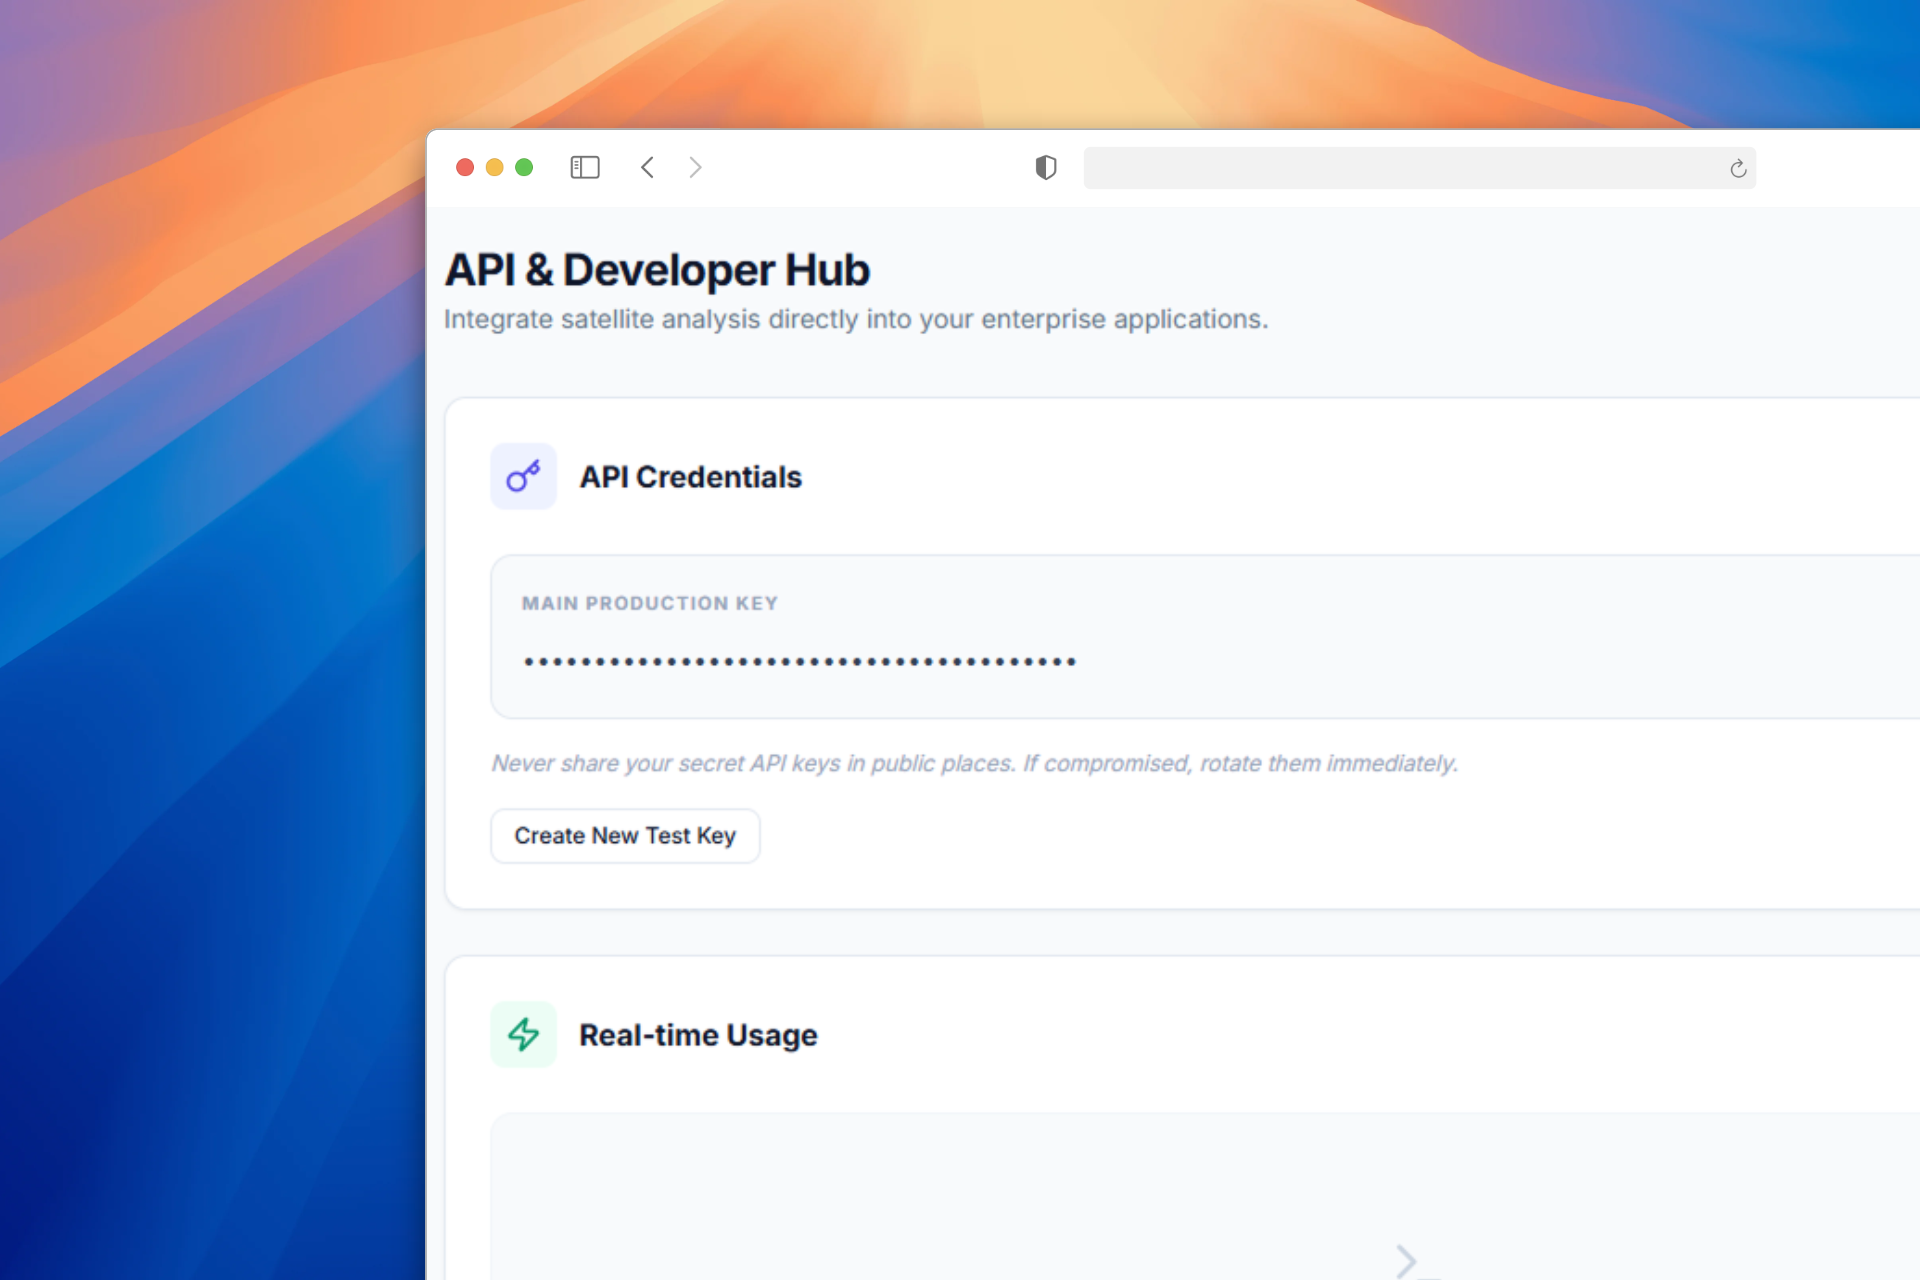
Draw a boundary, get an analysis
Three independently deployable services: a dashboard for people, an API that owns accounts and access, and a Python pipeline that does the science. Separated on purpose, so the user-facing parts stay fast while the heavy processing scales on its own.
- Interactive area-of-interest drawing on a MapLibre map
- NASA HLS scene retrieval with cloud and shadow masking
- Six vegetation and moisture indices computed per pixel
- Areas over 500 km² split into sub-regions and merged automatically
- Statistical rigour: Mann-Kendall trend tests, Sen's slope, z-score anomalies
- Results served as real map tiles, so users pan and zoom like a basemap
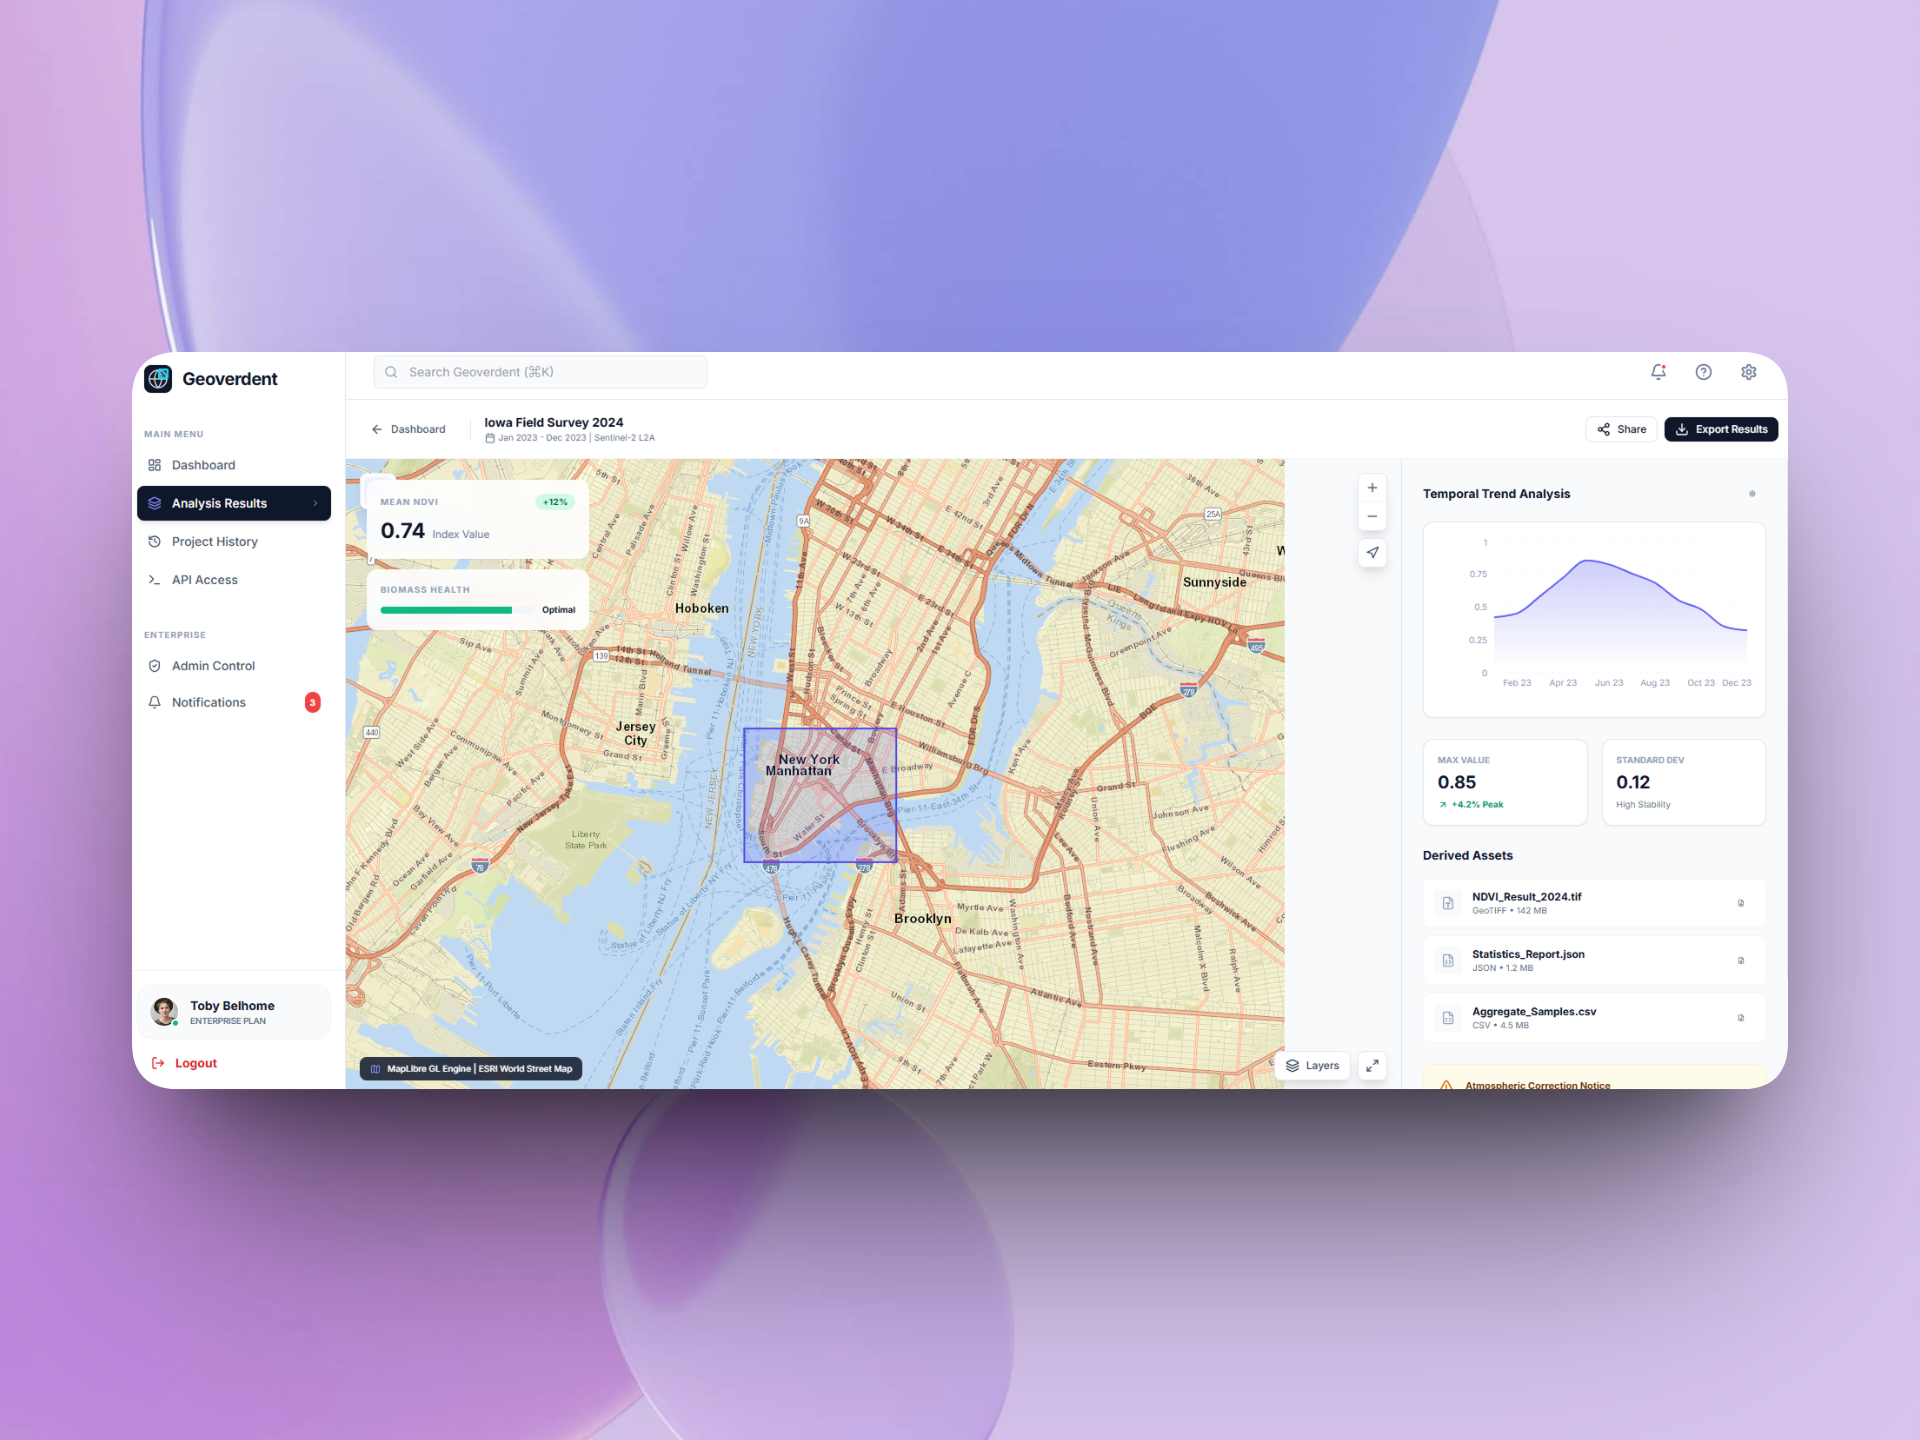
What it does now
Raw satellite pixels turned into a decision a non-specialist can act on.
- NDVI, EVI, NDWI, SAVI, NDRE, and LAI from one request
- Time-series trends with statistically detected anomalies
- Problem zones returned as geometry, not just a number on a chart
- HMAC-signed tile URLs for high-throughput map rendering
- Durable background jobs with retries and checkpoints
- An MCP server, so AI assistants can run the workflow too
Every month you leave it manual, you pay for it in salary.
Bring us the workflow that costs you most. Thirty minutes with an engineer, and you leave with the map whether you hire us or not.
Book a systems audit